Processes are at the base of every business, regardless of the size and industry. Every company relies on processes and workflows to carry out its operations and deliver its final output in the form of products or services. The problem is, these workflows are often fragmented into scattered documentation spread across the organization. Sometimes, they only exist in the mind of some team members. As businesses strive to scale, not having solid documentation of business processes creates critical vulnerabilities that can impact the business down the line. This is where business process management comes into play.
Thanks to business process management, companies can map, document and optimize their business processes for increased efficiency and productivity, as well as reduce bottlenecks and operational mistakes. One key element in business process management is process modeling, which essentially is the activity of mapping business processes in a visual way, so that they are easily accessible and understood by every member of an organization.
One of the most used visualization methods for mapping and representing business processes is the workflow diagram or flowchart. Let's dive into it and learn how you can implement workflow diagrams into your business.
What Is a Business Workflow Diagram?
A business workflow diagram, often simply called a flowchart, is a visual representation of a sequence of operations or tasks that illustrate a complete business process. Using standardized symbols connected by arrows, these diagrams map out the step-by-step progression of activities, decisions, and handoffs that occur within a specific business function.
Think of it as creating a map for your business processes. Just as a geographical map helps travelers navigate unfamiliar territory, workflow diagrams help team members navigate complex business processes, ensuring everyone follows the same route to reach the desired destination.
Unlike other business documentation, workflow diagrams use visual language to communicate process information. This visual approach is very effective, as it makes complex processes accessible to everyone, from new hires to executive leadership.
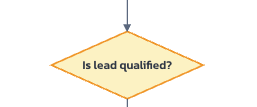
Example of a process workflow flowchart
The building blocks of a workflow flowchart
To fully understand workflow diagrams, the first thing to do is to get familiar to their most common components. There are several different methods of building flowcharts, but most companies stick to a standard set of symbols:
Oval or Pill Shape
This symbol marks the starting or ending points of a process.
Rectangle shape
The rectangle represents a task, activity, or operation within the workflow.

Diamond shape
The diamond shape indicates a point where a decision must be made, typically resulting in branching paths in the workflow. For example, a decision could be "is lead qualified?", which will then open two branches: "YES" and "NO". Each of those branches will then have their respective steps.
Arrow shape
The arrow connects steps with each other and shows their direction and sequence. Arrows can also have a label that describes the connection type or adds additional information.
The above example shows an arrow with the "YES" label, which in this case helps understand that a new branch is created as a response to the "is lead qualified?" decision step.
These are the most common symbols that apply to any business. There are of course more symbols that can be used, amongst which we have the parallelogram (representing data input or output) or the cylinder, which indicates data storage or retrieval, mostly used in IT.
Understanding these basic symbols is the first step towards creating and interpreting effective workflow flowcharts. The combination of these shapes creates a standardized visual language that communicates not just what happens, but how, when, and in what sequence activities occur.
The science behind the effectiveness of workflow diagrams and flowcharts
Due to their visual nature, workflow diagrams and flowcharts are very effective in documenting company processes. That's because human brain processes visual elements quicker than textual ones.
The research "Effectiveness and Utility of Flowcharts on Learning in a Classroom Setting: A Mixed-Methods Study" on a group of 128 pharmacy students identified that the use of flowcharts improved understanding of complex concepts for 86% of the group, and overall knowledge for 87% of students. The study therefore concludes that using flowcharts is a great way of effectively conveying information visually, improving concept retention.
Another study titled "The effective use of flowcharts in corporate training" assessed the effectiveness of flowcharts when it comes to company training. Specifically, the study aimed at understanding the impact of using flowcharts instead of textual formats when training employees on a new IT system that had been introduced in the company.
The study concludes that flowcharts are a significant help in understanding new company processes, therefore making them a great tool for employee up-skilling or onboarding of new team members. It also highlights speed, lightness and fixation/remembering as the most important aspects of flowcharts versus traditional text-based methods. Lastly, another advantage of flowcharts is the additional transparency of educational documents.
These are just a couple of studies to back the effectiveness of flowcharts. When it comes to business processes, workflow diagrams and flowcharts can be a great ally for organizations wanting to standardize operations and scale without compromising on standards. By working with, rather than against, our brain's natural information processing capabilities, workflow diagrams transform complex business operations into manageable, navigable pathways.
How to create effective business workflow flowcharts
Set clear boundaries for each process
Creating business process flowcharts requires more than just connecting shapes with lines. It is an introspection on your company's inner workings and requires planning and analysis.
As you start to think about your company's processes, you might realize things are not as straightforward as they appear. You might start to ask yourself whether a process can be broken down into smaller processes, or whether a process is actually redundant or can be optimized. You might even see that some processes are related to each other and, in some cases, can be merged into one main process. Setting boundaries for processes is key here, and something that seems easy at first sight but has its challenges, especially in companies with may moving parts and departments.
When you think about business process mapping, start by answering the following questions:
- What specific process are we mapping?
- Where does it begin and end?
- What is the trigger that initiates this process?
- What is the final deliverable or outcome?
Without these boundaries, workflow diagrams risk becoming sprawling, unfocused documents that try to capture too much and end up communicating very little. The aim should be to be specific and intentional about the scope of each diagram.
Collect different perspectives on the process
Another crucial aspect of creating effective diagrams is to gather different perspective from the different stakeholders involved in a process. Different team members often have slightly different understandings of how processes work. The sales team might see the customer onboarding process very differently than the implementation team does.
A well-crafted workflow mapping requires input from:
- Frontline workers who actually perform the process
- Process supervisors who oversee the work
- Recipients of the process outputs
- Cross-functional stakeholders whose work intersects with the process
This approach will ensure your workflow diagrams capture the full reality of your processes, not just one person's or team's perception.
When documenting workflows, there's a strong temptation to map what should happen rather than what actually happens. Resist this urge. A workflow diagram that reflects an idealized process rather than reality provides little value for scaling businesses.
Start by documenting the current state, including workarounds, exceptions, and pain points. Once this reality is captured, you can create separate "future state" diagrams for process improvement planning.
Use the right level of detail
The right level of detail in a workflow diagram depends on its purpose. Strategic overviews might capture only major process phases, while operational diagrams need to show individual tasks. When deciding on the level of detail for a specific flowchart, think about the following:
- Who will use this diagram?
- What decisions will they make based on it?
- What level of detail do they need?
A useful approach is to create nested diagrams: high-level overviews that link to more detailed sub-process diagrams. This layered approach accommodates different user needs while maintaining diagram clarity. Another effective approach is to link to detailed SOP (Standard Operating Procedures) or policies from the diagram. In this way, the diagram will visually represent a process, whilst SOPs will deep dive into the diagram steps with a greater level of detail. This contextual information transforms a simple diagram into a comprehensive process resource.
Validate the diagram
No workflow diagram is complete until it's been validated through walkthroughs. Gather the team and walk through the process step by step, using real-world scenarios:
"If a customer submits an incomplete application, what happens next?"
"When inventory drops below the reorder point, who is notified and how?"
These scenario-based validations often reveal missing steps, incorrect assumptions, and edge cases that weren't initially captured. Each walkthrough strengthens the diagram's accuracy and usefulness iteratively: this is what is known as business process optimization.
Implementing a business process documentation initiative
Now that we know how to create an effective flowchart, let's have a look at how to implement it at scale within the company to document its processes.
Start With High-Impact Processes
Begin by identifying processes that:
- Occur frequently
- Impact customer experience
- Currently cause operational pain
- Involve multiple handoffs between teams
These high-impact processes provide the clearest return on your documentation investment and should be prioritized over other processes. Over time, the aim is to document as many business processes as possible, but securing a detailed documentation on the business-critical ones is a strong way to start.
Build Internal Capability
Develop internal expertise in process documentation by:
- Training key team members in workflow mapping techniques
- Establishing documentation standards for your organization
- Creating templates that ensure consistency
- Identifying process documentation champions in each department
This is a key aspect for a successful business process management initiative. As we explain in more details in our business process management breakdown, giving ownership to team members and empowering them to advocate for workflow documentation and optimization will help with making this initiative a success. Without the buy-in and involvement of key stakeholders in the company, having a thorough process documentation is going to be a very challenging process.
Create a process repository
Where you store flowcharts and how you make them accessible to the wider team is as important as the flowcharts themselves. Having documented processes scattered around in different places or fragmented into different documents will most likely result in little to no adoption or adherence to such documentation and a gradual abandonment of the process management and optimization mindset.
In order to reduce friction as much as possible and ensure a smooth access to the company's knowledge and documentation, you should:
- Ensure easy access for all relevant team members
- Implement version control to track changes
- Create clear ownership for each documented process
- Establish regular review cycles
Make the flowcharts an integral part of the company's day-to-day operations
Just documenting business processes won't take you far. To really go to the next steps and establish a process-first mindset within your organization you need to have flowcharts front and center:
- Incorporate workflow diagrams into training materials and onboarding programs
- Reference them in team meetings when discussing process issues
- Refer back to them when an issue or a process breach occurs
- Use them as the basis for improvement initiatives
- Make them accessible at the point of work execution
- Use them when sharing a new company process
Measure and communicate value
Measuring the impact of having company workflows documented and optimized is key in understanding the benefits for the organization. Start tracking specific metrics impacted by improved process clarity, so you can clearly quantify the impact of any optimization in your processes. Some examples of metrics to measure could be:
- Reduction in errors or defects
- Improvement in processing time
- Decrease in onboarding duration
- Increase in customer satisfaction
- Reduction in process variability
Again, empower department members and challenge them with optimizing their team's processes by assigning them clear KPIs and metrics. This will help establish a process-first mindset within the organization, resulting in exponential improvements in efficiency and effectiveness over time.
Business workflow diagrams are an essential infrastructure for sustainable business growth. Process infrastructure enables businesses to scale while maintaining operational excellence and quality standards.
Having a clear understanding of your operational machinery and a process in place to continuously document its processes and refine it will give you a considerable competitive advantage versus companies that don't have business process management in place, and will create a solid base for scaling.
